Simplified Method For Calculating Surface Cut Volume from LiDAR or DEM using QGIS
Introduction
Calculating or estimating a volume for irregular features such as gravel piles or water dugouts used to be a time consuming and only resulted in rough estimates. Now that Drones/UAVs and photogrammetry software and techniques are fairly common place, calculating these volumes is easier and much more accurate.
This tutorial will walk us through how to use QGIS and elevation data to perform a simplified volumetric analysis (see advanced version here) on a landscape. The results will give us the volume of a feature on that landscape, such as a pile of gravel, dugout or building. Data sources can include LiDAR, point clouds derived from photogrammetry or raster elevation data.
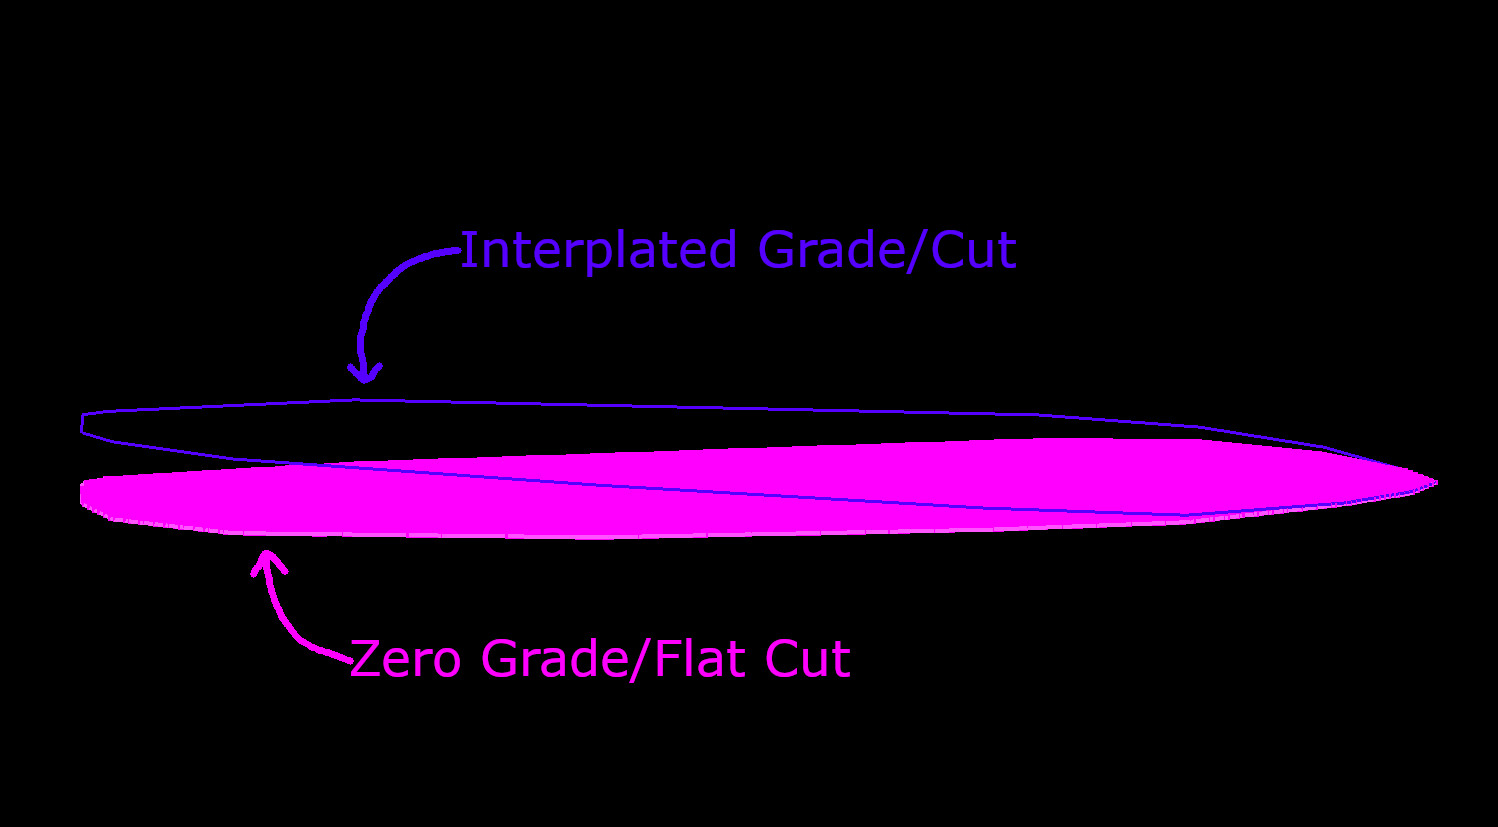
This simplified method uses a polygon area to clip the DEM and a single base elevation to base the volume calculations from. This method is best used for estimating volumes where the surface will be left flat, such as filling a lake to the level of a dam or leveling an area of ground. In contrast, the advance method creates an interpolated terrain that the volume is based on.
The difference in base surface between the advanced and basic methods can be seen below.
Step 1. Identify Volume Feature
Step 2. Create Clip Feature Layer
Step 3. Digitize Clip Area
Step 4. Clip DEM
Step 5. Identify Base Elevation
Step 6. Raster Surface Volume Tool
Step 7. Results
Conclusion
Step 1. Import Elevation Raster
After opening a new QGIS project, we will start by importing a DEM/DSM raster into the map. If you need to create a surface follow our tutorial on how to create a DEM from LiDAR tutorial here.
This surface should have a terrain feature with significant rise or constrained depth/hole over which a volume can be calculated. A section of sloped terrain can also be used for combining cut/fill volumes for leveling a section of ground.
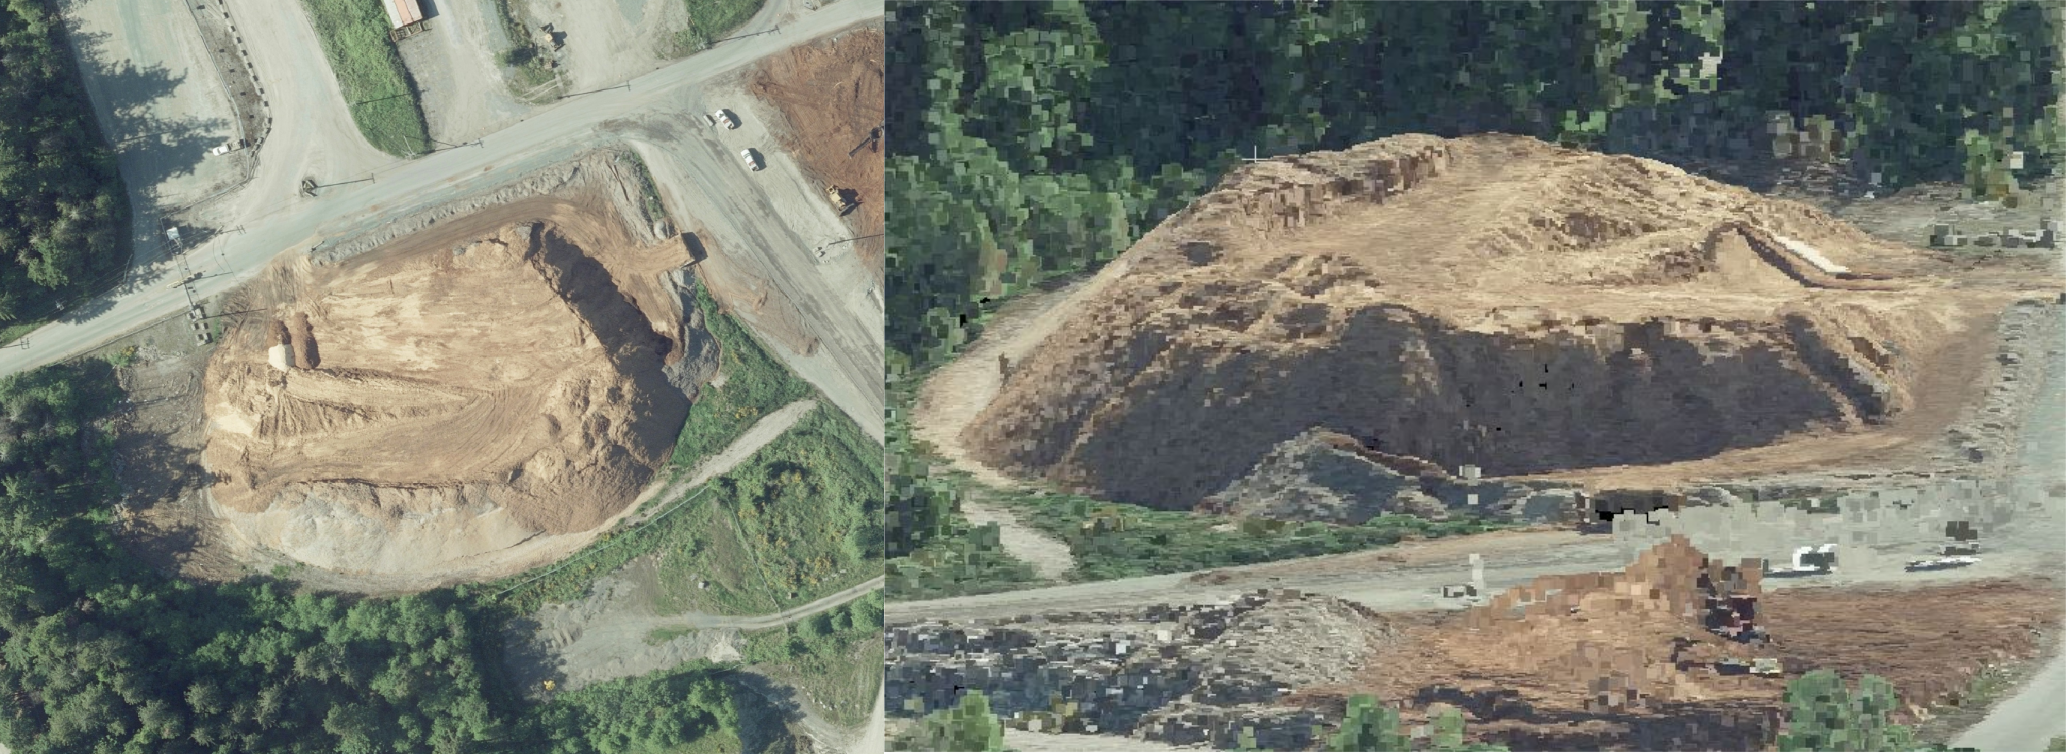
The image below the gravel pile that is our target volume area. We want to know how many truck loads of gravel are in the stock pile.
Target Volume Area
Step 2. Create Clip Feature Layer
We want to limit the DEM area for the Volume Calculations to make the results as accurate as possible. This requires creating a new polygon area to clip the DEM raster to.
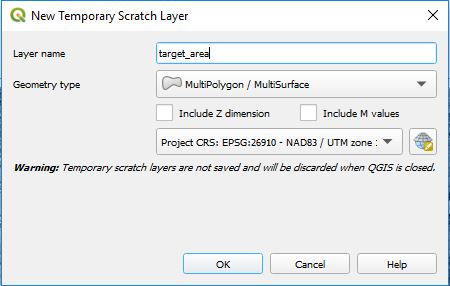
With QGIS create a "New Temporary Scratch Layer" from the Layer menu bar. Then from Create Layer select New Temporary Scratch Layer.
A new window will popup with settings for the temporary layer. Enter in a unique layer name, select a MutiPolygon/MultiSurface Geometry Type and ENSURE that the Spatial Reference System is the same as the DEM raster.
Step 3. Digitize Clip Area
With an empty polygon layer established we will now digitize the target area. Try to select edge directly at the base of the feature. Having high resolution imagery helps as well as a hillshade version of the DEM. Alternate between the two rasters to ensure the most accurate volumes possible.
Step 4. Clip DEM to Clip Area Feature Layer
To ensure we only perform a volume calculation on our digitized area, we willclip the DEM to the digitized polygon area.
To do this we will select/activate the DEM raster in the TOC then go back to the Processing Toolbox and search for "Clip raster by mask layer". The input values should be as follows:
Input Layer: DEM
Mask Layer: Clip Area Polygon Layer
Keep resolution of input raster:
Clipped (mask): //path/to/project/folder/output_name.tif
Open output file after running algorithm:
Step 5. Identify Base Elevation
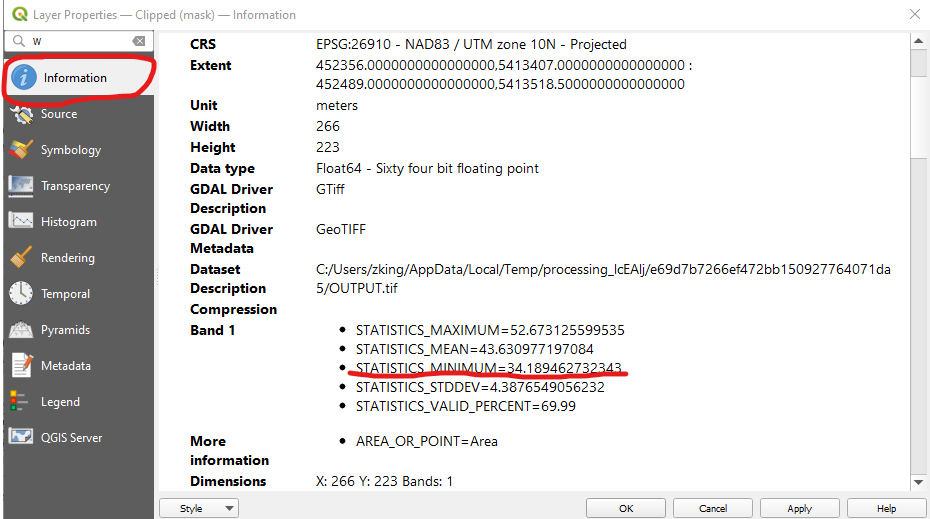
The basic method for doing a surface volume analysis requires that a base elevation be identified.This base elevation determines where a flat and level surface will be established and is the basis of how the cut and fill volumes are calculated. It is generally an elevation that is determined by the user or is generally the minimum or maximum elevation of the clipped DEM
There are two ways of determining a base elevation using QGIS. The first way is to open the properties menu of the clipped raster from the TOC and examine the raster information in the "Information" tab.
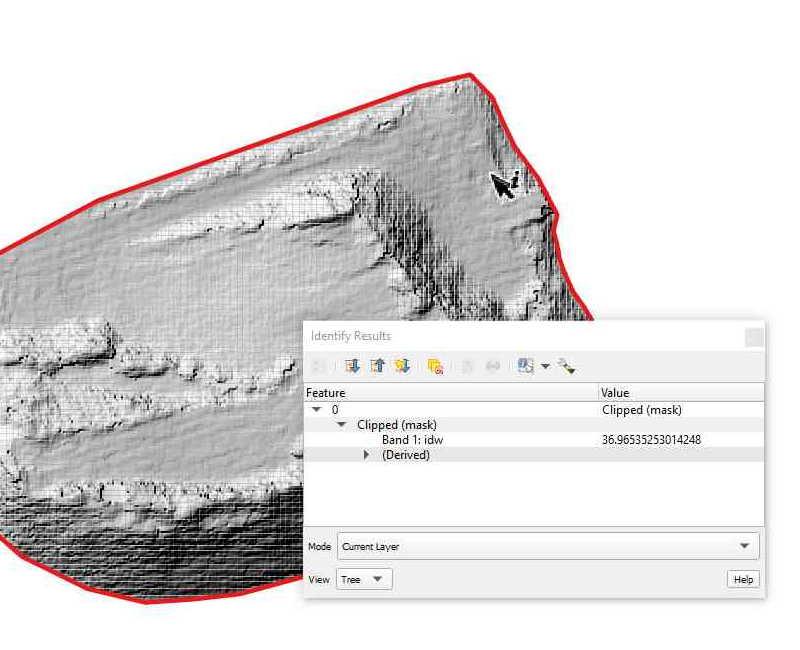
The second way is to highlight the clipped DEM in the TOC then use the identify tool to click on an area of the raster to identify the elevation. It is helpful to change the raster layer styling to Hillshade or use an orthophoto when choosing a base elevation.
Step 6. QGIS Raster Surface Volume Tool
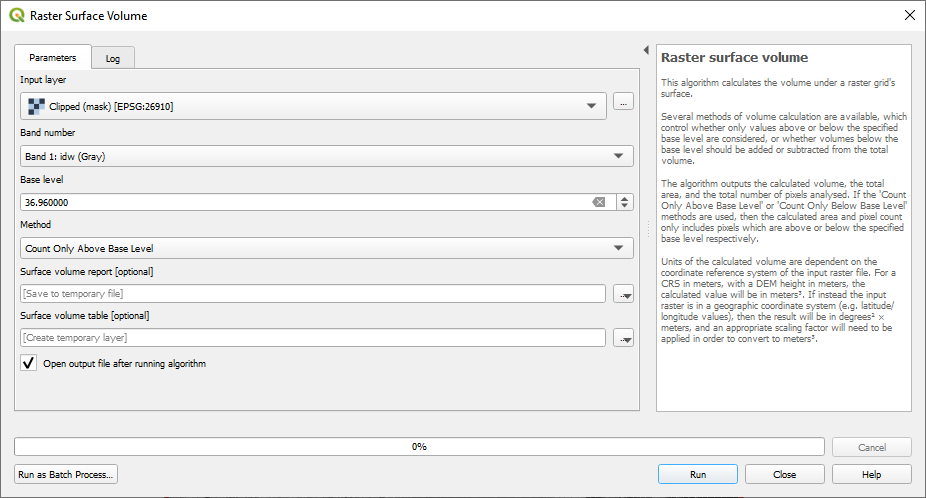
The final step for generating a volume calculation is to use the QGIS Raster Surface Volume tool. This tool can be found by searching for "Raster surface volume" in the Processing Toolbox search panel.
There are 3 parameters you need to enter into the processing tool: the clipped DEM raster, the base level (elevation) identified in Step 5 and the method in which the volume is to be calculated. There are also 2 output options where you can choose to save the results as an HTML file and/or as a table in QGIS. In this example we identified the lowest point on the gravel pile to be 36.96 meters, which will be the base level. We will also select the Count Only Above Base Level method as it assumes all material above that will be removed and any holes that happen to be in the area will not be filled. We will also save both output options to temporary layers/files.
Step 7. Volume Calculation Results
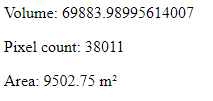
The results from the Raster Surface Volume Tool can be seen below. The volume for the area shown in this example is approximately 69884 cubic meters. In contrast, using the advanced method, the volume for the same area was approximately 56546 cubic meters, which is significantly less than this method. The accuracy of the calculation will really depend on what the resulting terrain will look like after the pile or hole in question has been removed or filled.
Conclusion
Calculating the volume of a surface feature can be performed in 7 easy steps using QGIS. This is essentially the process that many applications such as WebODM and Pix4D use in the background when calculating volumes. Being able to use QGIS will allow the user to have more fine grained control over the analysis and also allow for the possibility of calculating multiple features at once or using a model or script to do batch calculations.
Hopefully you found this tutorial useful and informative. If you have any questions or comments, please leave them below.
On Jan. 24, 2022, 12:21 a.m. gedser@finrank.biz says:
Very good tutorial. I don't suppose the tutorial data is available for download ? Keen to compare QGIS v MapInfo.