Introduction
Starting version 3.18, released in February 2021, QGIS can now be used to view point clouds and LiDAR!
It is now possible to open an .las or .laz file directly in QGIS to view a point cloud in 2D or 3D. When a point cloud is added to QGIS, it uses entwine to create an index of the point cloud in a directory beside the point cloud file you want to use. BE PATIENT! When loading large point clouds for the first time as it can take a few minutes to build the index, but once the index is built, the point cloud file will load super quick!
Overview
Download tutorial point cloud here
Add Point Cloud To Project
There are 2 ways to add a point cloud to a QGIS project. The first way to to drag and drop the .las or .laz file into the project. The second way is to use the QGIS Browser pane to open the point cloud file. If the point cloud file and the QGIS project are saved in the same directory, the second method is the quickest.
QGIS needs to make a tile cache of the point cloud when it loads the first time. Depending on your computer and the size of the point cloud, it will take some time for the data to tile and load. The point cloud will load much quicker after the first time.
Drag and Drop Point Cloud into QGIS Project
Add Point Cloud with QGIS Browser
View Point Cloud in 2D
QGIS 3.18+ will automatically generate a 2D view of a point cloud when it is added to the canvas. Not all point clouds are created equally, so the initial appearance may vary based what attributes are contained within the point cloud data.
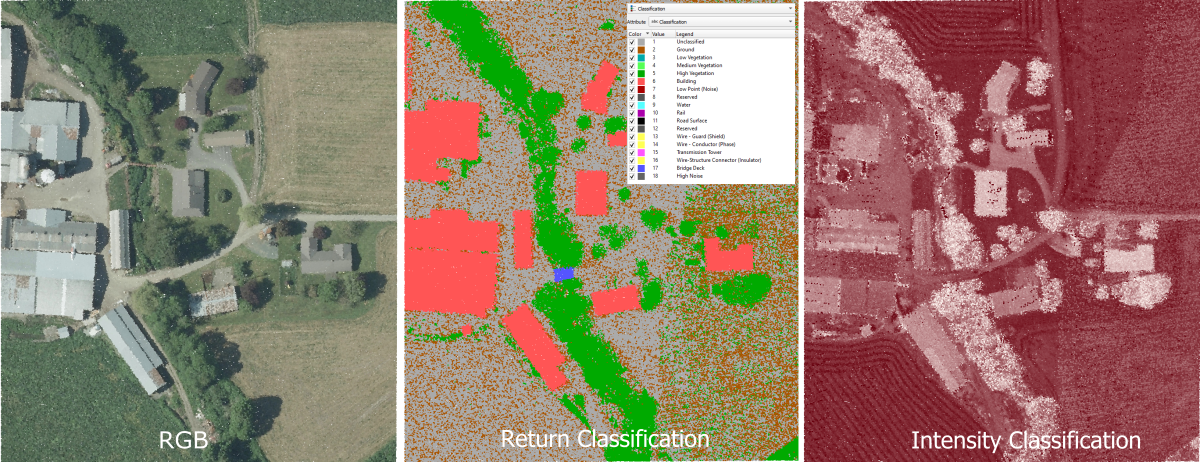
If the point cloud has be overlayed with an ortho image, then the point cloud may have RGB attributes and will probably initially look like an ortho image. If the point cloud does not contain RGB attributes, it will be displayed as a classified image with the different colors representing the type of LiDAR return value (i.e., Ground, Vegetation, Building, etc.).
It is quick and seamless to zoom in and out of the point cloud in 2D as a result of the tiling, even in large point clouds. It is very useful when digitizing building footprint or other features where accuracy is important or the feature is obfuscated by vegetation.
Understanding 3D, Point Clouds and QGIS
Viewing a point cloud in 3D with QGIS is a little less intuitive than 2D. There are a few factors to consider.
First, QGIS requires that the project is in a cartesian coordinate system (i.e, UTM) yet point clouds often do not have a spatial reference system packed into the file's metadata, in which case QGIS defaults to the World Geodetic System (EPSG: 4236) which is a geographic coordinate system. The point cloud will display fine in 2D, but the project CRS will have to be updated to reflect that of the point cloud. This can take a little guess work or investigation sometimes.
Second, the symbology for the 3D view must be explicitly set. By default QGIS has the 3D point cloud display set to No Rendering. So, we have to select how we want the point cloud to look in 3D before a 3D canvas is created.
Third, when the point cloud is added to a 3D canvas, both the 2D and the 3D visualizations will be visible in the view. The 2D point cloud will appear offset from the 3D creating an unwanted effect. It is best to adjust the 2D symbology to something completely transparent to be displayed as a bounding rectangle before the 3D canvas is created.
Forth and final, the elevation of the point cloud must be understood when adding a point cloud to a QGIS 3D canvas. The 3D canvas displays elevation starting from 0, the further a dataset gets from 0 the harder it is to navigate through. The best way to adjust for this is to offset the elevation values of the point cloud such that they are as close to 0 as possible. This can be done through the 3D symbology or by using the configuration menu of the 3D canvas. The 3D canvas settings are the best method if you are displaying multiple point clouds.
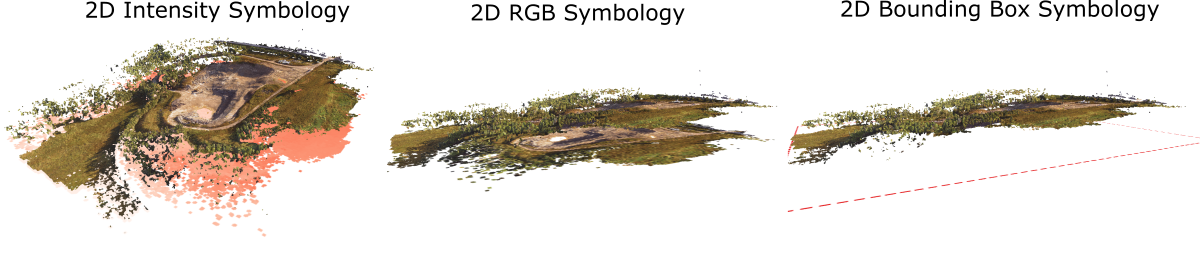
2D Symbology for 3D Canvas
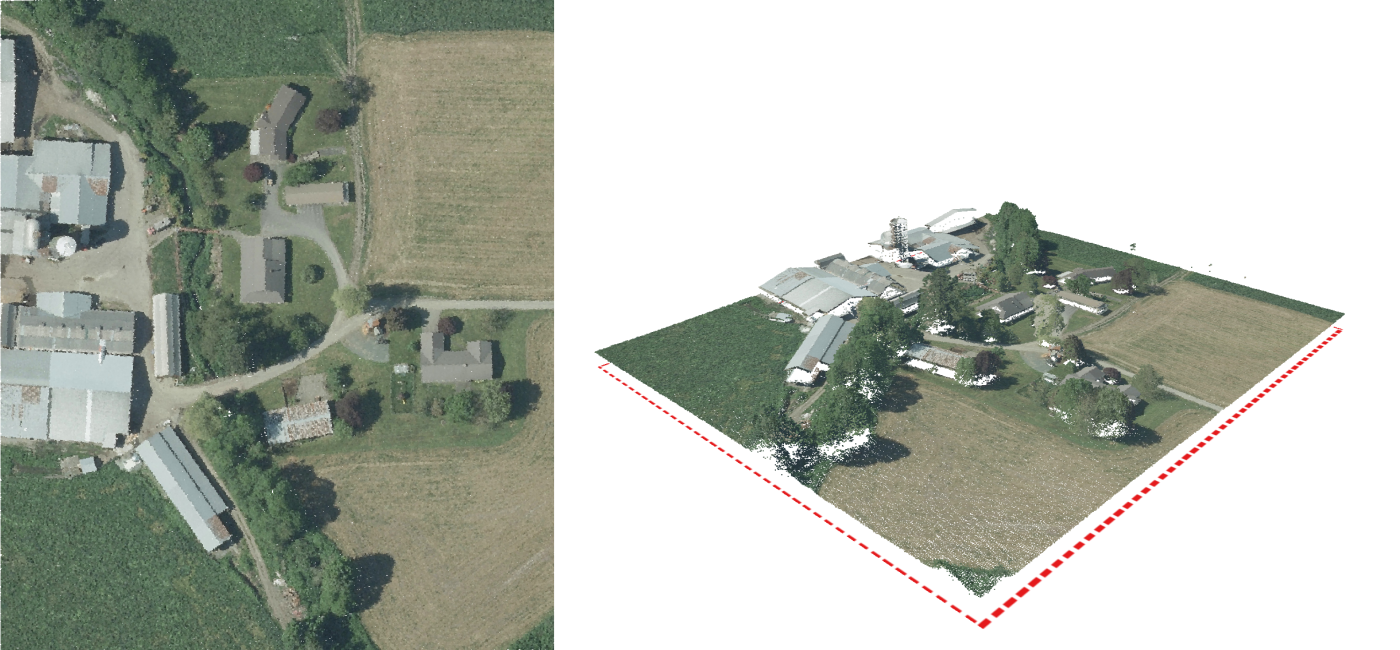
2D symbology must be taken into account when designing a layout for a 3D canvas that will display a point cloud. The 2D and 3D aspects of a point cloud can tend to conflict with one another on a 3D canvas in QGIS. The 2D version of the point cloud will appear on a flat plane and can interrupt the view of the 3D point cloud which is usually on an uneven plane and can have gaps in the point cloud allowing for the 2D plane to become visible. The best advice here is to keep the view simple and set the 2D symbology or rendering to completely transparent or display only the bounding rectangle.
The images below highlight why it is important to remove or limit the 2D symbology when viewing the point cloud in 3D.
Prepare Point Cloud for 3D Canvas
3D Canvas Symbology
We will now adjust some settings in the point cloud properties to optimize the 3D canvas rendering. There are 2 options we will have to adjust in the settings of the point cloud before we open the 3D cavas: 3D Symbology and Elevation Offset.
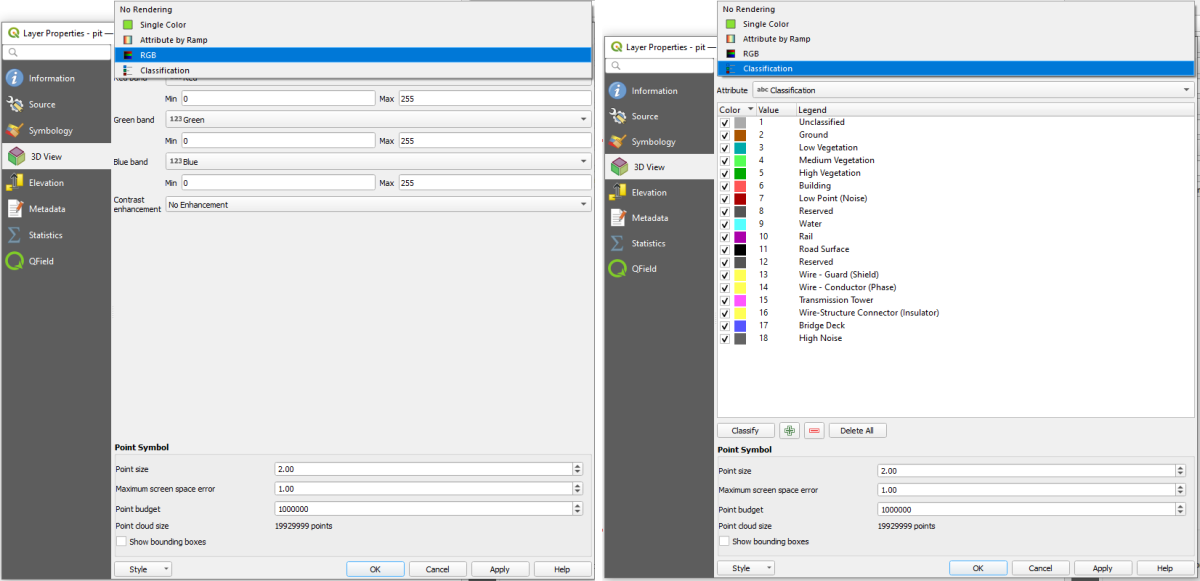
The first property we will adjust is the 3D symbology of the point cloud. To do this we will open the properties window for the point cloud or use the Layer Styling panel and adjust the 3D View options. By default it will be set to no rendering. There are several ways in which the point can be colorized, but the two best options are to use the RGB colors (if the point cloud has been overlayed with imagery) or by using color classifications based on descrete point cloud attribute class Classification/Return Type. These two classification methods will allow for the best feature contrast in the 3D view. Using color ramps on continuous attributes such as intensity or z/elevation will lead to a scene that does not have very good contrast; however it may be preferred on terrains that have only one type of feature (i.e. ground with no vegetation or buildings).
Point Cloud Elevation Offset
The second property we will adjust is the elevation offset. Adjusting the offset will set the base elevation of the point cloud to zero which will make the point cloud easier to manipulate in the 3D map canvas. This correction is most beneficial if the z values of the point cloud are significantly above sea level or zero. If the minimum elevation of the point cloud is close to zero, then you can probably skip this step. NOTE that if you have multiple point clouds in the view then this offset will have to be set the same for all the point clouds or they will not show correctly in relation to one another (or set the offset in the 3D Map Canvas Settings).
To adjust the elevation offset we can open the properties window for the point cloud or use the Layer Styling panel and adjust the Elevation. The default offset should be 0. We have the option to enter in a specific elevation or use the button to the right to have QGIS generate the offset automatically, which is the simplest approach if you are only viewing a single point cloud. The automatic calculation is basically subtracting the minimum point cloud z-value from 0, thus offsetting the point cloud to start at sea level. You can verify this number by opening the point cloud properties, going to the Statistics option and checking the Z Attribute minimum value. This times minus 1 (-1) will be the ideal offset.
Create 3D Canvas
The final step in viewing a point cloud in 3D is to create a 3D canvas. By default, QGIS opens with a 2D canvas and will display the point cloud in 2D when it is added. For 3D visualizations we have to add a 3D Canvas by opening the View menu at the top of the window and selecting New 3D Map View. You can also use the control-alt-m keyboard shortcut to open a new 3D canvas
A new window will open that you can resize or dock. It will open with a top down view of the point cloud but can be manipulated by using the left mouse button to move the scene forward/backward and left/right. Clicking and holding the mouse wheel or middle button will tilt and rotate the scene. Finally, the right mouse button can be used to zoom in and out of the scene.
Conclusion
In order to view, navigate and display a point cloud in 3D using QGIS we must first adjust the 2D symbology to be completely transparent or to only show the bounding box, we must also set the 3D symbology and adjust the elevation offset before opening a new 3D canvas. If we follow these steps we will now be able to view 3D point clouds and LiDAR in QGIS (versions 3.18 and above)!