10 Reasons why you should consider using QGIS
QGIS has always been a reliable GIS program that has filled a lot of the gaps the ArcGIS has not been able to fill (mostly due to lack of $$$ for licensing). In the last year I have switched to using QGIS almost extensively. The following list is a summary of my top 10 favorite aspects of QGIS that I have come to rely on.
1. Drag and Drop
QGIS can visualize and usually manipulate almost any vector or raster GIS data format imaginable.
It many mapping work flows you often have to use data that has been generated in another type of system such as Googe Earth (kmz/kml), AutoCAD (DWG/DXF), Excel (XLS/CSV) or web services (REST/WFS/WMS).
This ability saves a TON of time. GIS data comes from many places and on larger projects GIS technicians often have to incorporate data from multiple different companies using a wide array of different software and in order to synthesize all the information all the different formats must be brought into one common format. QGIS is unbelievably good at this!
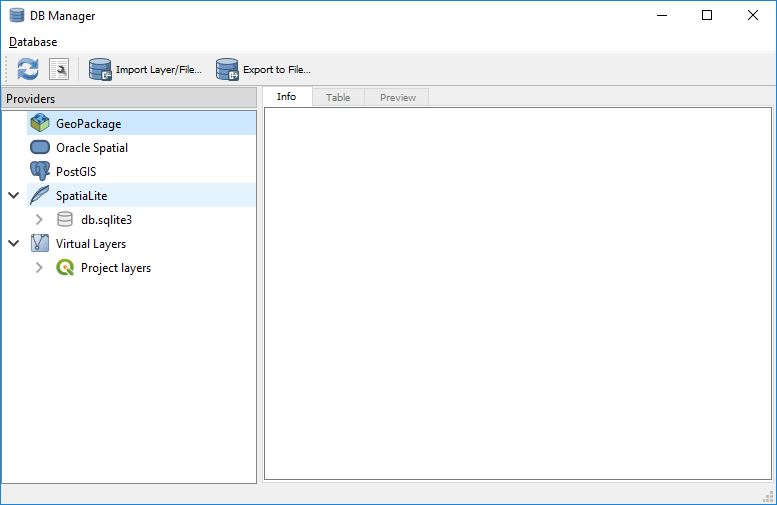
2. Relational Database Connectivity
Incorporating relational databases into GIS projects and workflows, especially multi-user object-relational database, greatly improves the capacity for performing analysis, collecting and sharing data.
QGIS makes it simple to connect to these databases and provides an interface to manage, view and import spatial data without having to know the SQL language. As an added bonus the QGIS Field Calculator and Filter can be used to modify and analyze the data.
3. Symbology Interface
Version 3.0 was a huge step forward for QGIS. There were countless improvements made to the program. One of my favorites is the new interface for refining layer symbology and labeling. Adjusting symbology is now a much more dynamic and fluid process. A layer styling panel can be opened to the side of the main view that updates every time a layer is highlighted in the layers panel. The map view updates as the settings are tweaked which saves on opening and closing a bunch of windows to verify your settings. It is also easy to transfer the settings to another layer by copying a layers style and pasting it onto another layer.
4. 3D Visualization/Modeling
Another major addition to QGIS that appeared with version 3.0 is the ability to visualize data in a new 3D view. Through this view you can create 3D fly throughs with any data supported with QGIS when using an elevation raster as a base. It is also possible to extrude vector data based on an elevation field to create simple objects such as buildings (See GIF). This ability continues to improve and be more stable as new iterations of QGIS are released.
5. Digitizing Interface
Digitizing points, lines and polygons was one of features that really drew me in to QGIS. It is simple to create topologically correct datasets with the vector snap settings that allow snapping to edges, vertices and intersections. There are also advanced settings that allow for snapping to a subset of the layers visible on the map.
There is also an advanced digitizing tool that allows CAD like drawing with key shortcuts for setting line angle and distance and a construction mode that allows you to sketch the outline of the geometry to ensure everything is in line and then complete the feature using the outline. It may be a long way from CAD drafting but it make digitizing with a GIS fast accurate and efficient.
6. Extensibility with Plugins
QGIS has a large user/developer community that contributes many useful tools that can easily be added to QGIS. These plugins range from easy to add basemaps, tools that allow for advanced digitizing, hooks into routing services to geoprocessing tools. If you have a challenging GIS task to overcome and are thinking that you will have to write some code to accomplish the task, do a quick search of the QGIS plugins, there is a good chance someone will have already built something to help you out.
Two of my favorite plugins are MMQGIS and OSM Tools. MMQGIS extends many of the geoprocessing tools built into QGIS. There are some particularly useful tools for importing CSV files and for geocoding points with options to use a few different sources. OSM Tools is a useful source for quickly finding driving routes and isochrones (i.e. how far you can drive in x amount of time).
7. Python Integration
Similar to ESRI’s ArcGIS Desktop and ArcGIS Pro, QGIS uses python as a scripting (Pyqgis) and programming tool that allows advanced users to interact more deeply with the GIS layers, geometries and layouts. Python functionality is essential for automating repetitive tasks and for customizing workflows. It saves time and ensures consistency.
Below is a simple example of how pyqgis can be used to iterate through each geometry in a layer, and create a regular grid of points for a polygon to aid in density analysis.
# connect to sqlite database
uri = QgsDataSourceUri()
uri.setDatabase("C:\\Projects\\data\\Analysis.sqlite")
schema = ''
table = 'temp_pts'
geom_column = 'GEOMETRY'
uri.setDataSource(schema, table, geom_column)
desnity_pts = QgsVectorLayer(uri.uri(), 'density_pts', 'spatialite')

polys = QgsProject.instance().mapLayersByName('Polygon_Layer')[0]
features = polys.getFeatures()
temp_pts_pr = density_pts.dataProvider()
count = 0
for f in features:
	geom = f.geometry()
	vl = QgsVectorLayer("Polygon?crs=epsg:26910&field=id:integer&index=no", "temporary_poly", "memory")
	pr = vl.dataProvider()
	pr.addFeature(f)
	vl.updateExtents()
	pts_grid_output = processing.run("qgis:regularpoints",
	{'EXTENT': vl, 'SPACING': 2, 'INSET': 0, 'CRS': 'EPSG:26910', 'IS_SPACING': True, 'OUTPUT': 'memory:pts_grid'})
	pts_grid = pts_grid_output.get('OUTPUT')
	pts_clipped_output = processing.run('native:clip',
	{'INPUT': pts_grid, 'OVERLAY': vl,
	'OUTPUT': 'memory:pts_clipped'})
	pts_clipped = pts_clipped_output.get('OUTPUT')
	temp_pts_pr.addFeatures(pts_clipped.getFeatures())
    count += 1
    print("Processing feature: {}".format(count))
QgsProject.instance().addMapLayer(temp_pts)
print('Processing Complete')
8. Basemaps
Adding basemaps from the web is a phenomenal step forward for GIS in the past decade. Basemaps are usually backgrounds that are added to a map to accent the map styling with orthographic imagery, street maps with predefined styling, satellite imagery. A lot of this data requires a lot of memory and computer power to process. Being able to add it as a webservice feely and easily with QGIS saves on time and money thanks to some open source providers.
Sources such as NASA, OpenStreetMap, and USGS Landsat provide public access to their web services which make for awesome basemaps without the need to download all of the data! It is easy to add many of the maps directly to a map using the QuickMapServices plugin.
9. Layer Styling
To be a complete desktop GIS the software must allow users to not only analyze data but to display it in a meaningful and visually pleasing way. QGIS fits this description perfectly. With the relatively new Layer Styling panel it is easy to set and adjust symbology and style while seeing the updates take place live offering a little more fine grained control. This process can be time consuming to get right and often needs to be done on multiple layers with similar parameters. QGIS makes it easy to copy some or all of the style settings and paste them into another layer. Super time saver!
10. Map Layouts
QGIS has a separate view called a Print Layout where map layouts can be constructed for print or pdf. QGIS's map layout tool is an easy way to make single maps, map books, images and graphics.
One of my favorite new features in QGIS 3.X is the ability to prevent map labels from hiding behind titles and other map surround objects on the print layout. In my years of creating technical maps for reports it was always a challenge to keep labels from being partially covered by titles, disclaimers, north arrows, inset maps, etc. The QGIS layout view now has a function that allows users to select layout elements to block labels from appearing below them or within an adjustable distance from the edge.
Activate this function in a QGIS Project Layout and view any Map element Item Properties. There is a ribbon of map control icons at the top of the item properties with a yellow “abc” label icon on the right side. Click on this icon to set up the label blocking properties for one or many map layout elements. Repeat for any map element that has labels that need to be blocked.
On Feb. 15, 2020, 6:30 a.m. ezcardinfo says:
Yes explained awesomely